While enabling Conductrics’ adaptive testing is a powerful way to auto-optimize your app, there are times when you might want to run non-adaptive tests. Maybe you want to test something that you will apply in other media, or perhaps you want to do online research on your customers, to give you additional insights into their wants and needs.
Adaptive or Non-Adaptive – Your Choice
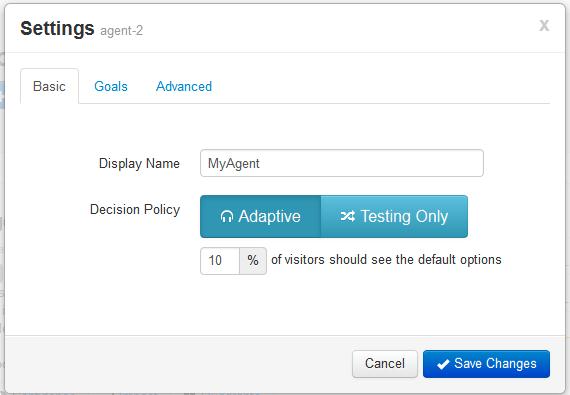
Regardless of the reasons, we have tried to make it super easy to toggle between adaptive and non-adaptive testing. In fact, in our UI you can just click a button at any time during the project to switch between the two modes of testing.
Ok, so let’s say you decide to run a standard A/B style test. You are going to want to have some way to evaluate the results of your experiment. Your Conductrics account gives you a couple of ways to get at your results.
Accessing the Report
The first, and simplest way, is our Confidence report. This report is accessible via your online Conductrics’ console under the Confidence tab displayed for each of your agents.
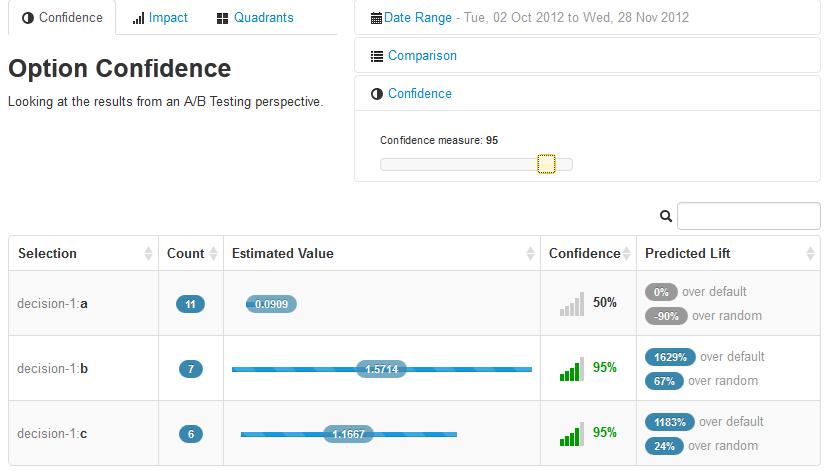
Clicking on the Confidence tab brings you to the following report.
I won’t go into all the detail here but let me cover a few of the main parts of the report:
- Count – how many times each option has been selected
- Estimated Value – this is the mean or average value of selecting each option, along with a visual representation of the confidence interval. These values are based on measured success of each option with respect to your selected conversion goals, and their associated values.
- Confidence – a simple visual representation of the statistical hypothesis test that we run, which is used to determine if we have enough evidence to conclude that the option in question is out-performing the default case.
- Predicted Lift – This calculation tells us how much of an improvement we should expect if we were to only use this option. We calculated this two ways, the first uses the selected default as the baseline, and so the result is how much better we should expect to do relative to the default. In some cases, say when it is a totally new project, there really isn’t a default. So we also provide a lift calculation over the average value of all of the options.
We like this report because you can get answers pretty quickly from just glancing at how well each option is doing.
The Reporting API
Of course, following our everything with an API philosophy, you can also access the report results via the Conductrics Report API. I won’t get too bogged down on the API in this post but here is a quick look in case you might want to play around with it.
Getting the report results is as simple as calling the API, which looks something like the following for our report above:
http://dev-api.conductrics.com/owner_jCjJBWDqI/agent-2/report/confidence/2012-10-02/2012-11-28?apikey=admin_XXXXXXXXXXXXXXXXXXX&confidence-measure=95&comparison-decision=decision-1%3Aa&aggregated-over-dates=true&_=1354487918299
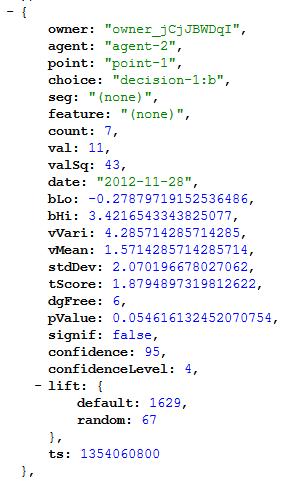
This URL will return a JSON object with all of the data in the report, as well as some additional nitty-gritty that your stats person can poke around in. Here is a bit of the JSON for option-b in our report.
The JSON contains information about the agent as well as the option and what decision and decision-point it belongs to. Additionally, if the agent is using targeting, we would get back a result for each segment or user feature.
Along with the basic data points provided in the UI report, the API passes back the t-score, p-value, as well as the variance and standard deviation of the results. There are a few other data points in there, but they aren’t too important, we can discuss them in a future post on hypothesis testing. Oh, for those interested in these sorts of things, we use the Welch pairwise t-test, and apply a Bonferroni adjustment to help alleviate repeated test bias.
Also, some of you may have noticed that the Confidence report only provides pairwise comparisons. We will be porting over our multivariate analysis report (essentially main effects ANOVA) down the road, and look forward to your feedback.
Make your own Adaptive or standard AB tests. Sign up for a Free access today at Conductrics
Tags: Reporting


